I built a live progress monitoring dashboard for my special education classroom. Here’s what happened.
A custom tool for logging IEP goal progress, independence, and interventions in real time — and what it changes about writing progress reports.
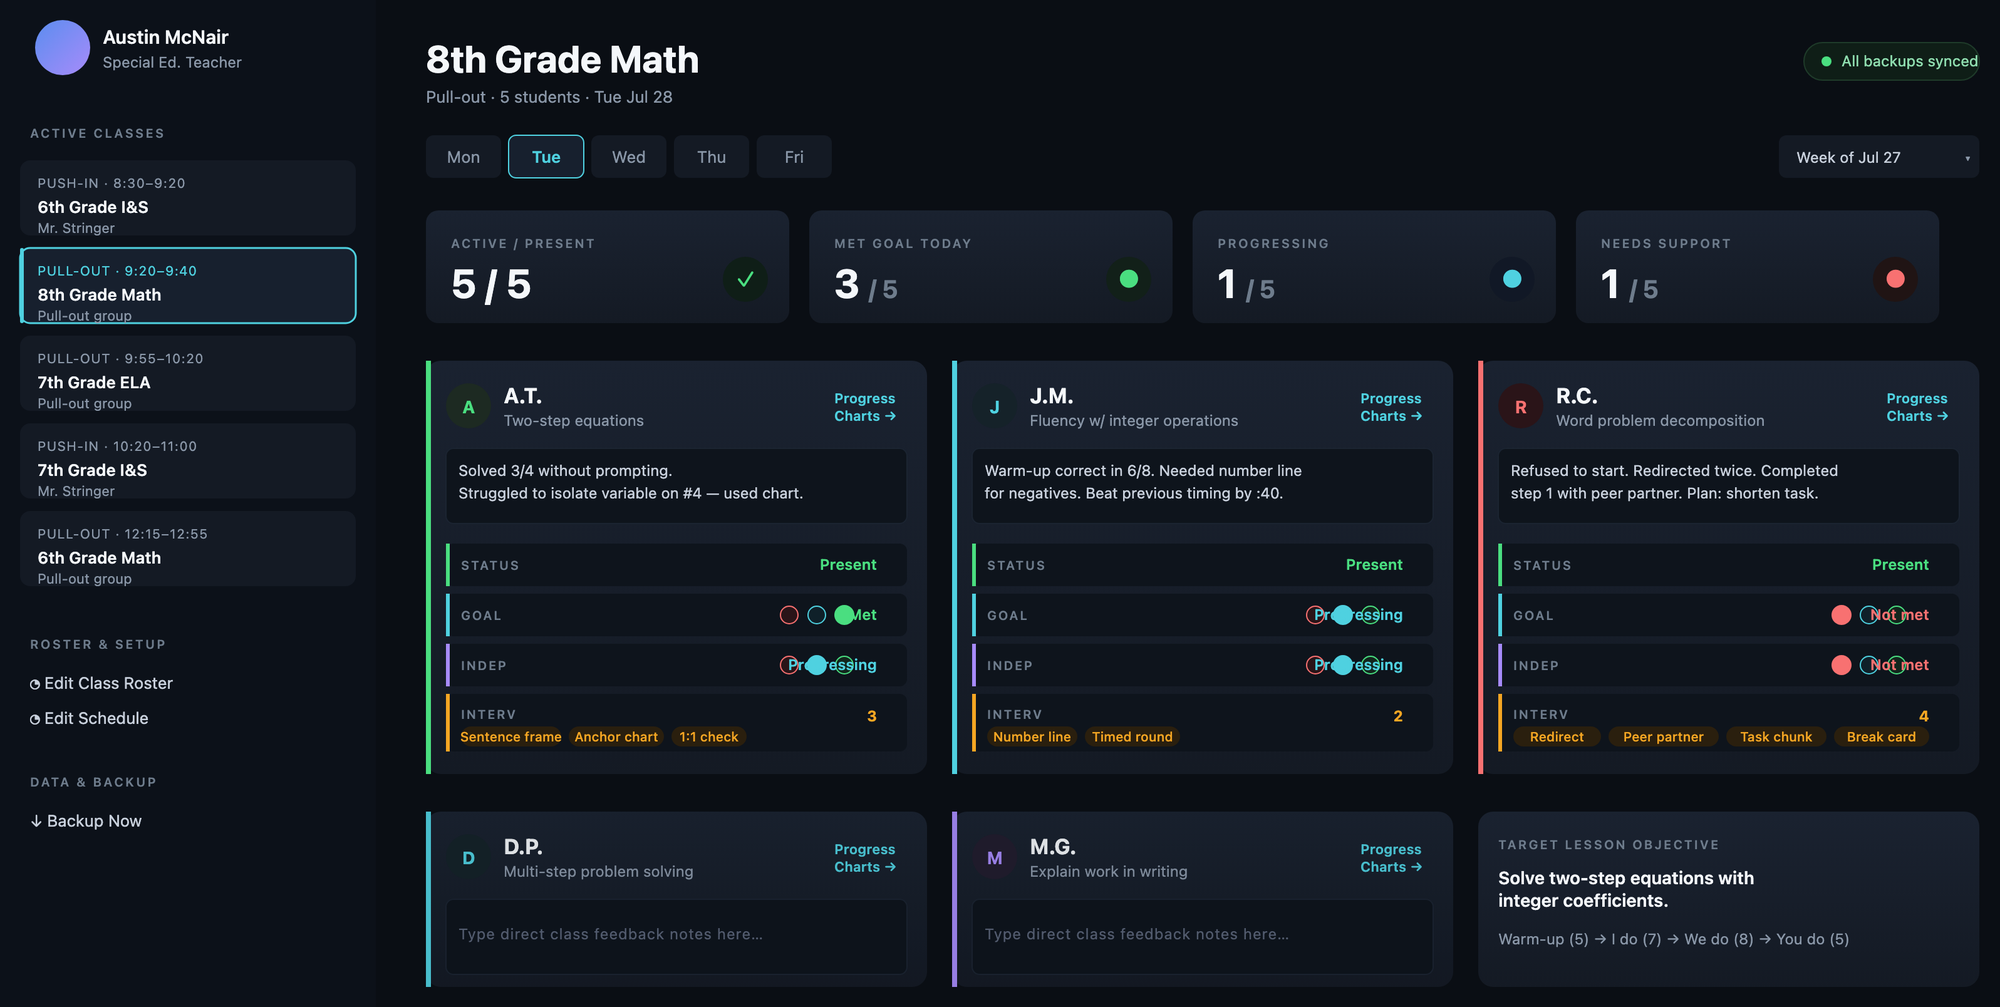
Fig. 1Dashboard overview — a class roster where every student card carries the day’s goal, independence, and intervention state at a glance.
In special education, data collection often happens long after a lesson ends. I might try to recall who met a learning outcome, who needed a prompt, and who was sitting quietly in the back. But relying on memory at the end of the day usually leads to vague records — and vague data makes writing meaningful IEP progress updates an uphill battle.
I wanted a system that would let me record direct observations in the moment, without pulling me away from teaching. So I decided to try something new, and I built a custom Progress Monitoring Dashboard.
The design: data entry at the speed of teaching
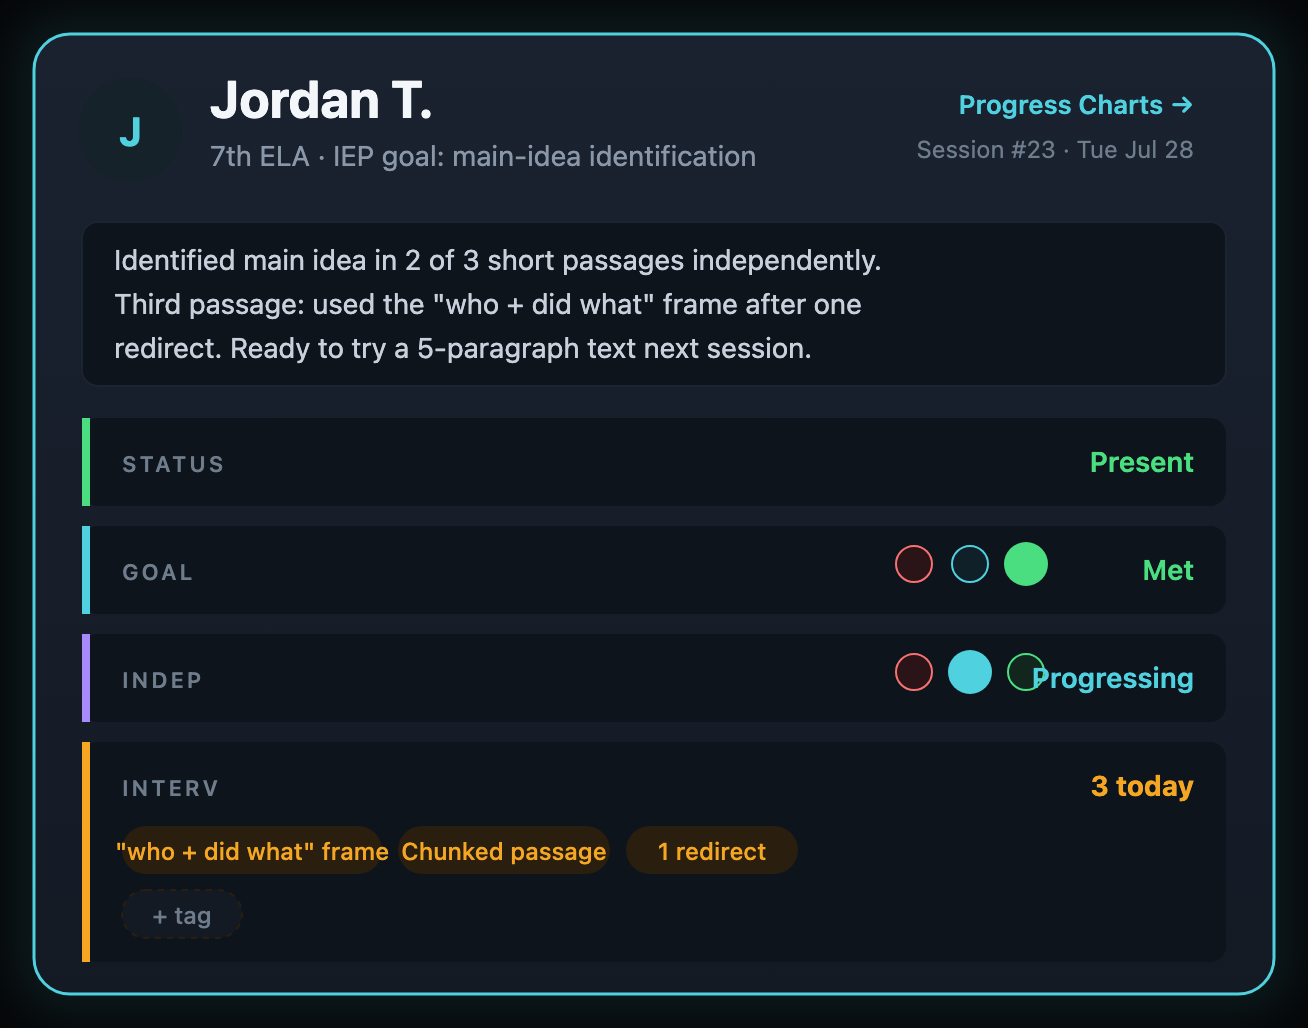
The goal was simple: design an interface that lets me track three core metrics per student during small- or whole-group instruction.
- GOALGoal Progress. Whether a student met their target learning objective for the day.
- INDEPIndependence Level. How independently the student completed the task versus requiring heavy prompting.
- INTERVIntervention Level. The frequency or tier of supports provided (scale 0–5).
Alongside those quick dropdowns, each student card includes a text area for rapid, real-time observational notes — like capturing behavioral triggers or physical complaints right as they happen.
How it changes IEP writing
Having clean, time-stamped data logged during class changes the entire reporting process.
1. No more guesswork
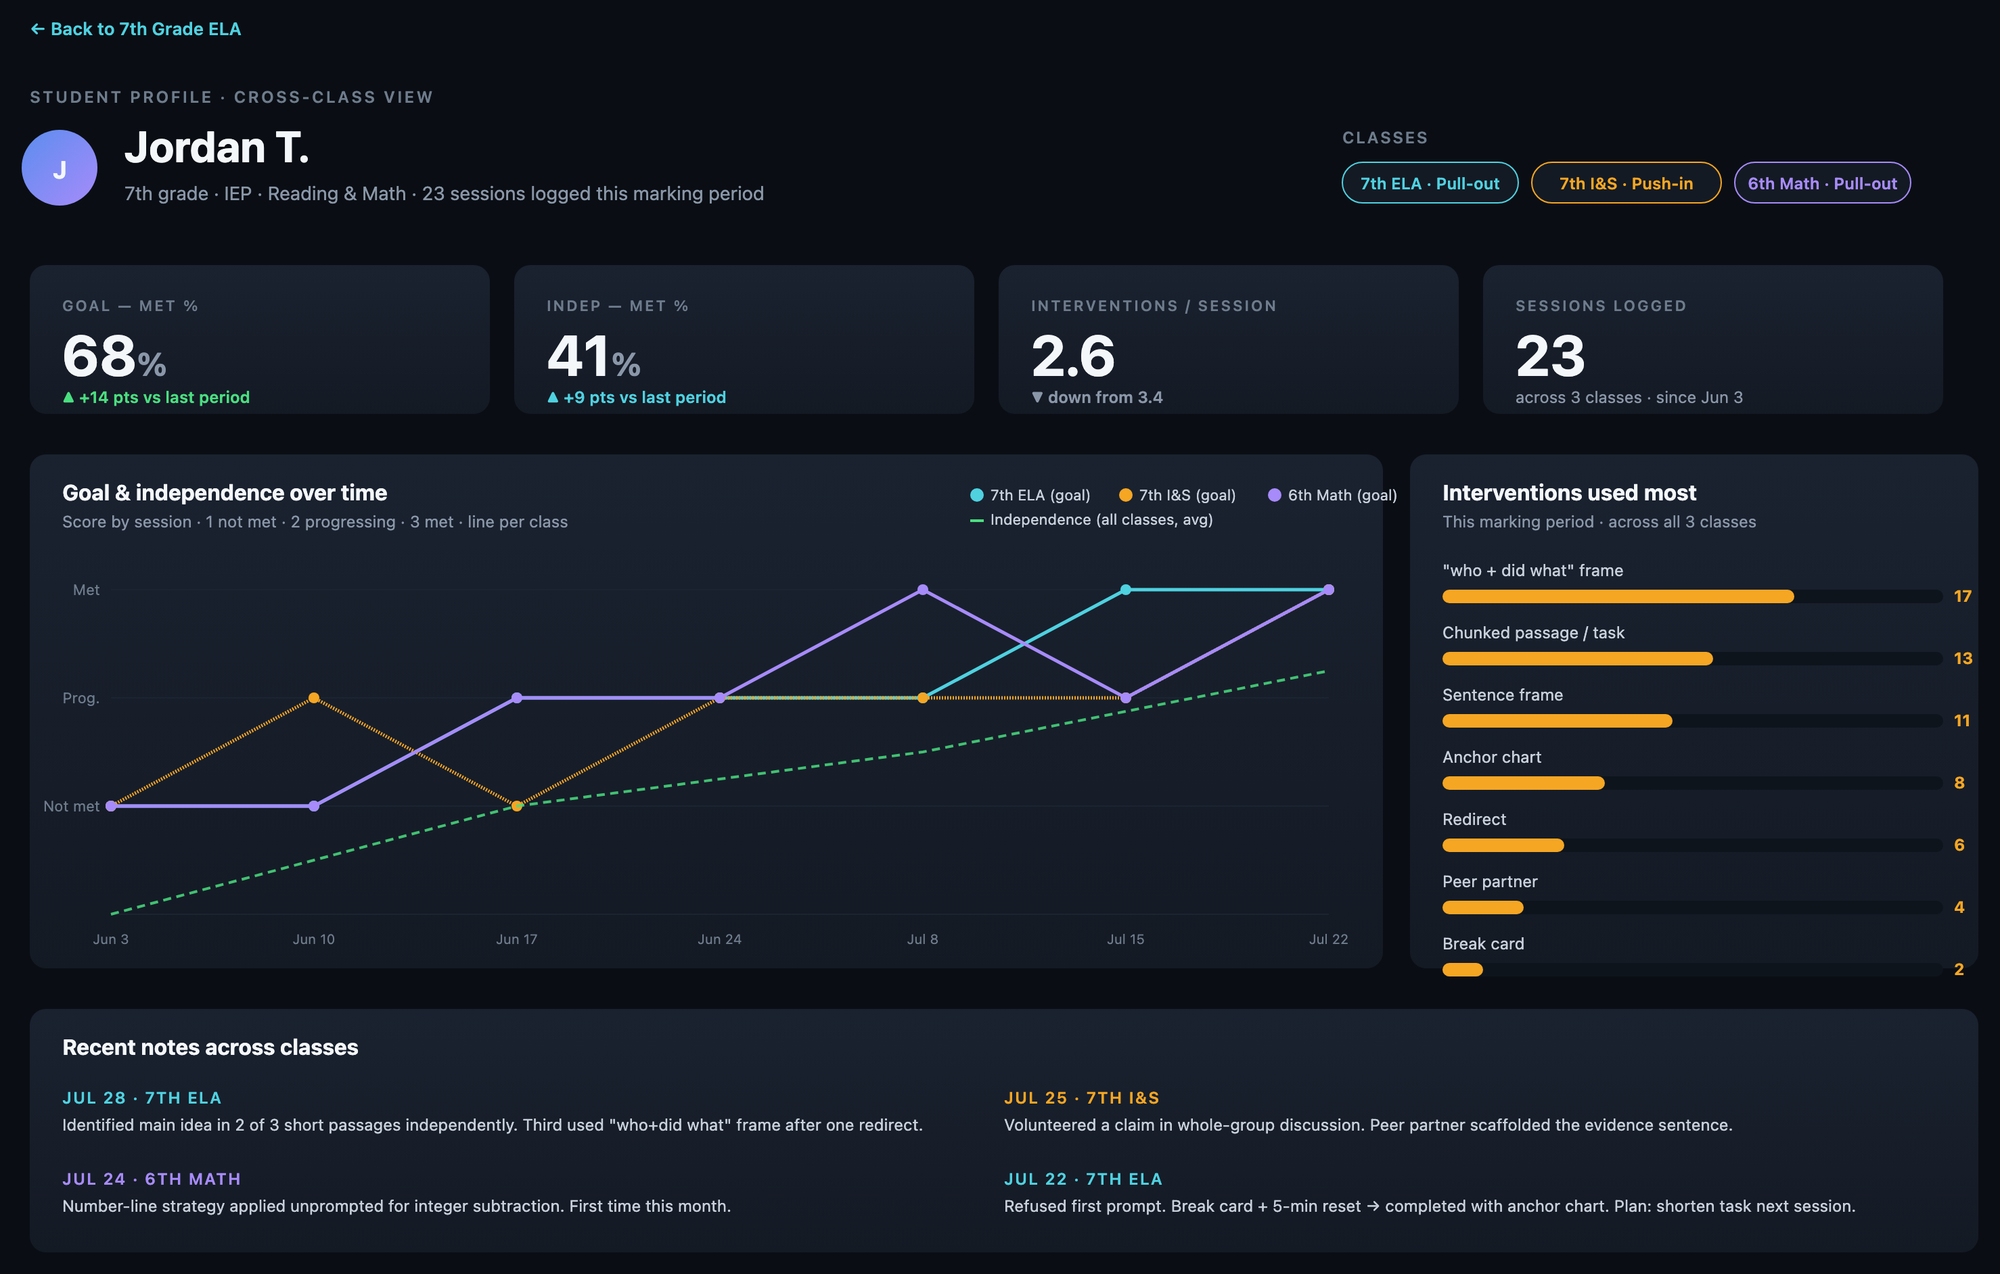
Instead of guessing how often a student needed support over a nine-week period, I have structured records. I can see exact trends in goal mastery alongside independence metrics.
2. Concrete evidence for meetings
When discussing progress with parents, administrators, or IEP teams, I don’t just say, “They’re doing better.” I can export a CSV report or pull up the dashboard to show specific dates, direct observations, and intervention counts.
3. Clearer next steps
By separating target goal performance from independence levels, I can quickly tell whether a student understands the material but still needs prompting, or whether they need an adjusted instructional entry point.
Nothing about this replaces professional judgment, official paperwork, or quarterly benchmarks—and it isn’t trying to. Instead, it turns in-the-moment observations into structured, actionable data. By tracking goal mastery, independence, and intervention levels simultaneously, it replaces guesswork with clean evidence, making progress reports straightforward and daily instruction more precise.